55.9% of all websites use Google Analytics [1]. If you run one of them, you’ve likely heard that Google is migrating Google Analytics from its current version, Universal Analytics (also known as UA or GA3), to the new version, Google Analytics 4 (GA4).
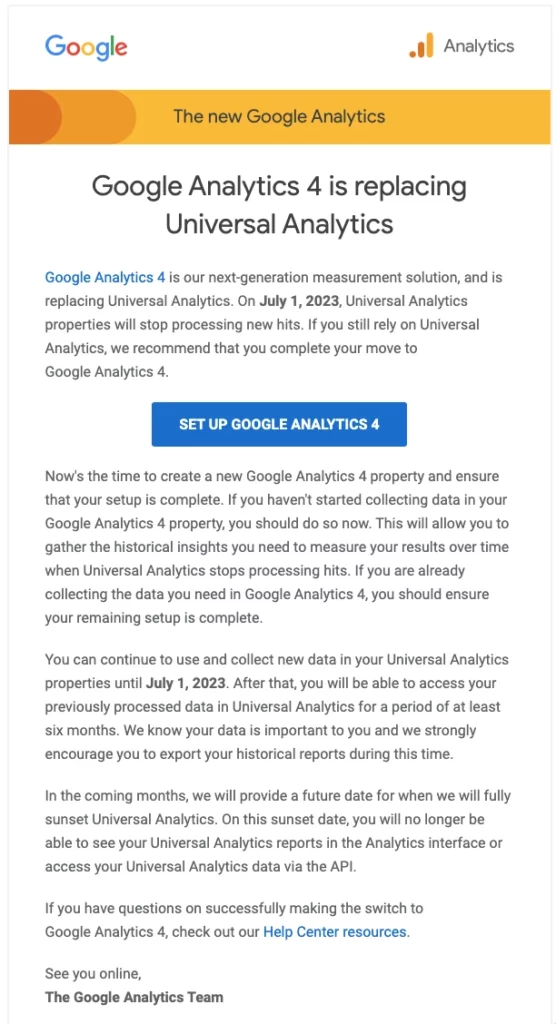
For business owners who haven’t yet made the switch, you would’ve received an email from Google in November reminding you of the approaching July 1, 2023 deadline. Due to its steep learning curve, it’s a good idea to get ahead of the change before it becomes a problem.
In this comprehensive guide, we’ll walk you through everything you need to know about Google Analytics 4, compare it with Universal Analytics and explain how you can get started using GA4 right now so that when the sunset date arrives, you’ll be in a good position.
What is Google Analytics 4?
GA4 is not actually that new – Google first launched the latest incarnation of their marketing-leading analytics product on October 22, 2020. It’s Google’s answer to a cookie-less world that Apple and other privacy-focused companies are pushing for.
What does this mean for website owners like you? Despite its learning curve, you get a new and improved analytics platform based on a fundamentally different way of measurement.
Google Analytics 4 offers a complete picture of the buyer’s journey in ways that Universal Analytics was not designed to do.
While Universal Analytics can attribute customers’ purchases to the last action they took before making a purchase, it fails to show you the entire process.
For example, if a customer’s behavior began with a view of your Instagram post then a visit to your site, followed by reading three of your emails, and finally two weeks later going on their laptop and clicking a Facebook ad and making a purchase — all you would see is that the customer converted via Facebook on desktop, ignoring the other critical interactions that led up to that sale.
Unlike its predecessor, Google Analytics 4 focuses on measuring “events”― the individual interactions each user has with your website, like loading a page, clicking a link, or completing a purchase.
Because it no longer relies on stored IP addresses, Google Analytics 4 uses machine learning and artificial intelligence to give business owners the insights they need about their customers while respecting the privacy protection laws (GDPR and CCPA) that previously prevented GA3 from telling the complete story.
The Deadline is Coming
Universal Analytics will be retired on July 1st, 2023. For those who’ve held off upgrading to GA4, time is nearly up.
If you’re like most websites and are still using a UA property, no new data is collected after the July 1 st deadline, and your existing historical data will be accessible for one year. (Updated April 27 2023 – when Google had originally stated six months).
That information will likely no longer be accessible beginning in 2024, and you’ll need to export your Universal Analytics data. Google hasn’t yet made it easy to export this data (unless you know how to use BigQuery).
Do I Need to Upgrade to Google Analytics 4?
The short answer is yes. With the looming deadline, you’re left with three options:
- Do nothing. After the July 1st deadline, you’ll no new analytics data will be tracked. If you’re reading this, you likely haven’t switched yet so you also won’t have any historical data to do year over year comparisons until you migrate over – which means less data to make informed decisions.
- Switch to another (paid) analytics tool, such as Plausible or Fathom
- Upgrade to Google Analytics 4
During this transition period, GA4 allows you to set up a property to run alongside your existing Universal Analytics.
For now, we recommend using both.
Although Google Analytics 4 is stable, updates are constantly being released. And if you’re used to UA, GA4 can be intimidating. If you’re in UA regularly, we recommend running them in parallel so you can compare metrics and reports to see how your key measurements are impacted by the shift, and then alter your reporting accordingly.
Or, if you currently use bounce rate to measure how well a page is performing, this feature will no longer be included in GA4 after the switch.
By using both, you can start collecting historical data and tracking metrics relevant to your business in its new form while also using the existing platform to compare notes as you go.
What’s Different Between Universal Analytics and GA4?
Besides a drastically different interface, the main difference between Universal Analytics and Google Analytics 4 is that GA4 uses a different measure model. That means the way data is collected has changed – GA4 tracks events now instead of sessions or page views. GA4 also allows for tracking cross-platform activity – businesses with apps rejoice!
Let’s take a closer look at five of the key differences between GA4 and UA:
1. A Brand New Dashboard and Interface
The first thing you’ll notice is the new, streamlined dashboard, with many of the old options removed. The navigation bar on the right includes buttons for Home, Reports, Explore, Advertising, Configure, and Library.
Where UA structured data into three tiers: Account > Property > View, GA4 restructured these tiers to now only include Account and Property.
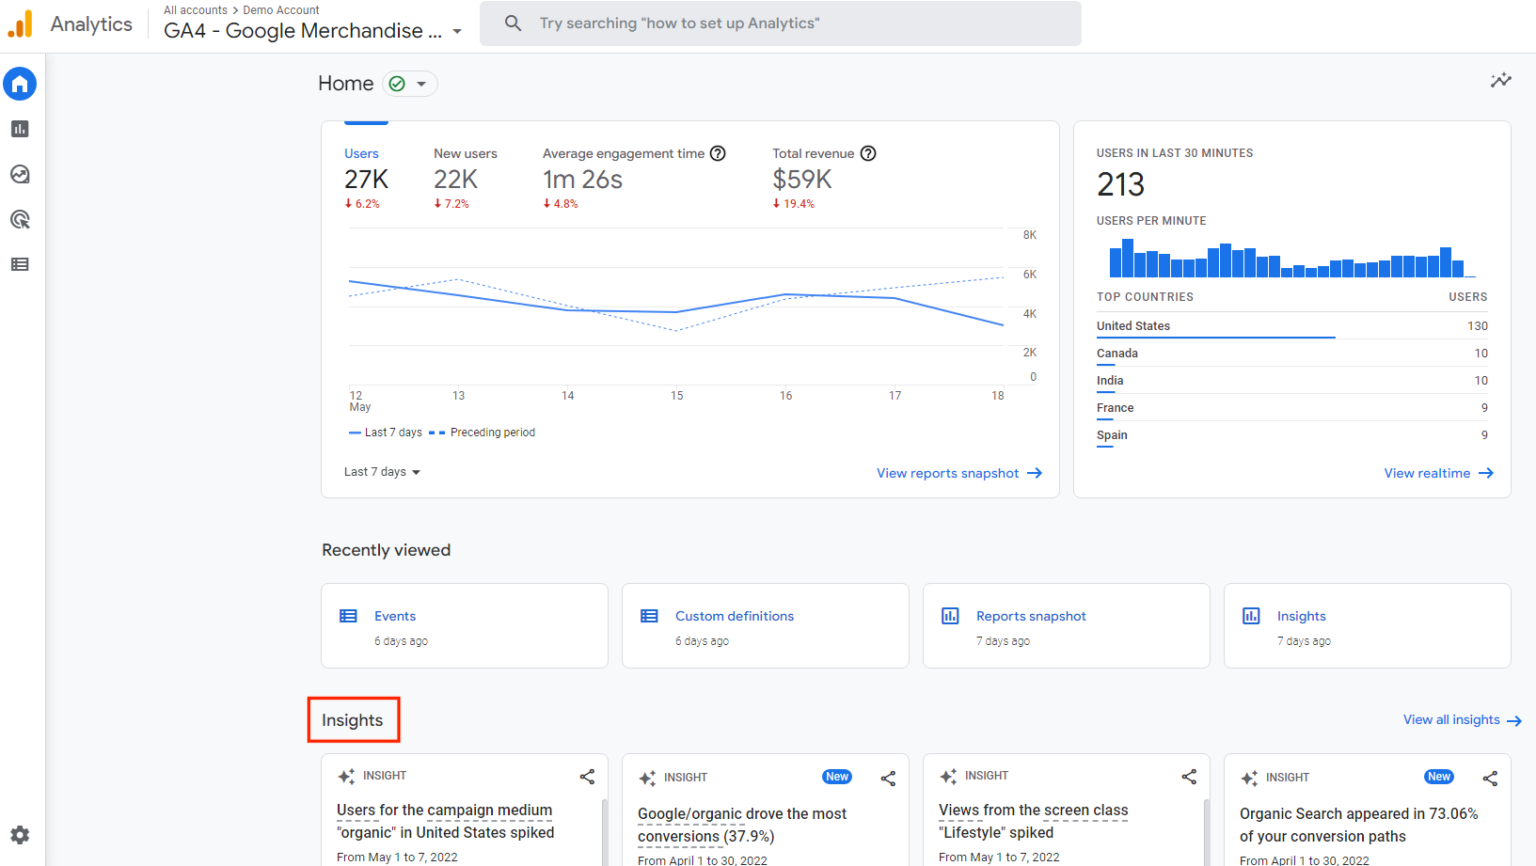
At the bottom under “Insights”, you’ll see predictive insights based on Google’s Artificial Intelligence, meant to highlight helpful information for your business. We imagine these will get better over time.
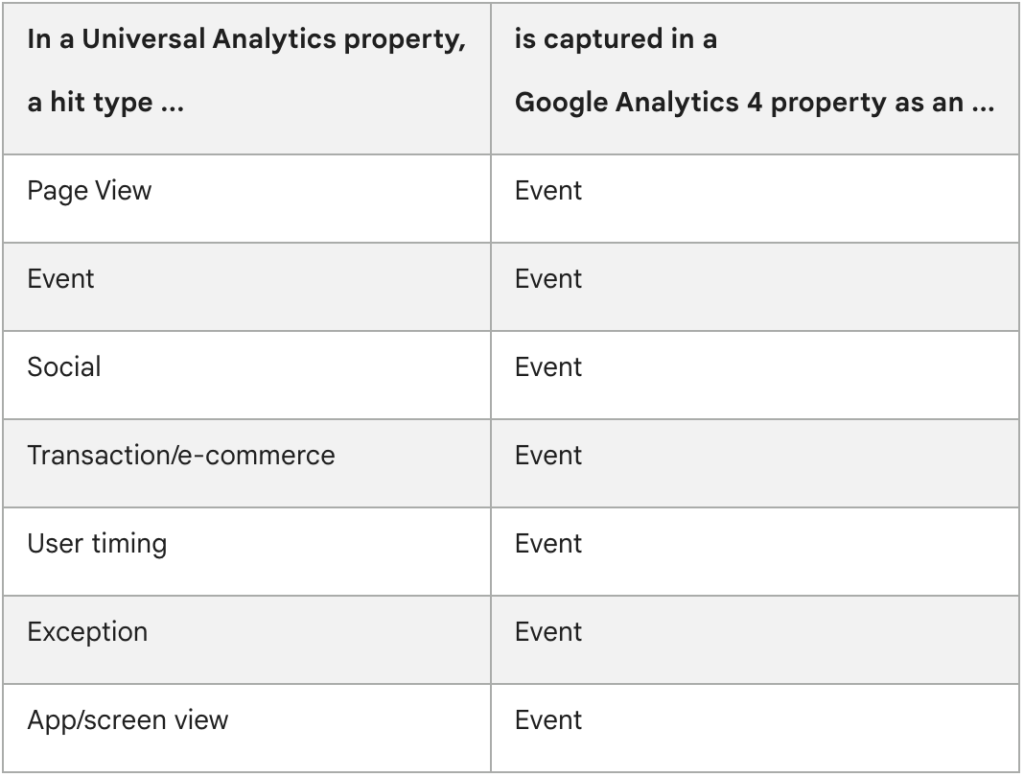
2. Measurements Are Considered “Events” in GA4
In Universal Analytics, page views were the de facto metric. With Google Analytics 4, all measurements are now considered events. This allows you to gain a more complete understanding of how users interact with your website and apps, like via page views, button clicks, and scrolling behaviour.
This change allows companies to track their customers’ journey throughout their website, rather than simply focusing on which pages were viewed.
GA4 also features an array of new engagement metrics (that are useful to SEO) like:
- engagement rate
- engagement time
- engagement sessions
3. GA4 Supports Predictive Metrics
Previously, Analytics could only show your user’s past behaviors and interactions. While this was helpful in understanding your audience’s past patterns, it left a lot to be desired when it came to making decisions impacting how they would behave in the future.
GA4’s new predictive metrics allow you to view data on a much larger scale, significantly improving retargeting campaigns using AI metrics like purchase probability, churn probability, and revenue prediction.
With these newly available metrics, GA4 users can create entire audiences based on their predicted behaviors.
For example, one audience might be “users likely to make a purchase in the next 10 days” or “eCommerce users likely to spend more than $1,000 in a single purchase“.
With these enhanced audiences formed, they can then be targeted using Google Ads campaigns or via social media.
4. Enhanced Integration with Google Ads
In addition to the enhanced audience insights, businesses have been requesting for years a tool that allows them to measure app and web integrations together.
GA4 now allows users to track purchases from Google Ads, YouTube Ads, other non-Google paid channels such as Facebook, and organic channels, including search, social media, and email.
This mobile data integration allows you to measure the overall impact of your marketing investments, regardless of acquisition channel.
5. Tracking Across Platforms
With UA, tracking users across platforms was extremely challenging.
Through unique user IDs assigned at the time of login, the new Google Analytics 4 enables you to view the complete customer journey from start to finish, from device to device, website to app, and so on.
When linked with the appropriate script, your website or app will send user IDs from each logged-in session to GA4, and all associated user metrics will be logged.
When a user logs in again on an alternative platform, the report will connect with their unique ID in order to pick up where they left off, helping you to better understand your customers’ cross-platform experience.
How to Migrate to Google Analytics 4
If you’re setting up an entirely new property, you have no choice – it’s GA4 or nothing. For existing businesses with a UA account, you’ll need to migrate to GA4.
Unlike many software upgrades, however, it’s not as simple as clicking an “Update” button.
In order to fully transition from Universal Analytics, you will need to have both implementations set up simultaneously — one for UA and one for GA4.
We recommend creating a new GA4 property as soon as possible because you can’t import historical data from the legacy version. In other words, start collecting new data now so you have more data to compare against, and get familiar with the tool before completely replacing the legacy version next July.
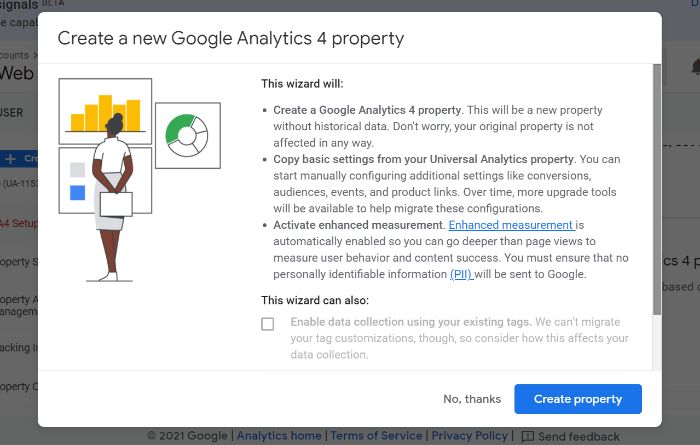
You can use the GA4 Setup Assistant to migrate settings from your Universal Analytics site to the new GA property.
How to Set Up GA4 Properties and Data Streams
If you’re just getting started with GA4, follow these steps to set up your first property:
1. If you do not yet have a Google Analytics account, visit this page and click “Get started today”. Otherwise, sign in to your existing Google Analytics account.
For new Google Analytics users: Go to the Admin section of your profile and click ‘Create Account’.
2. After selecting a name for the account, click “Next” to add a property to the account.
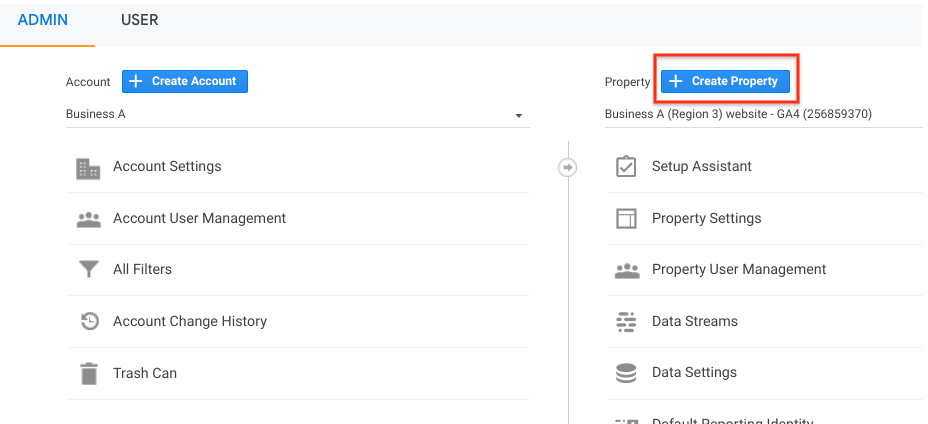
For existing users: In the ‘Admin’ section of the client account, select the correct property. In the ‘Property’ subsection, click ‘Create Property’.
3. Complete the fields with an appropriate name, time zone, and currency. Next, choose an industry category and business size.
4. Update on April 6, 2023: Google Analytics has since changed its process of creating a property. Now, you have the option to select your desired business objectives.
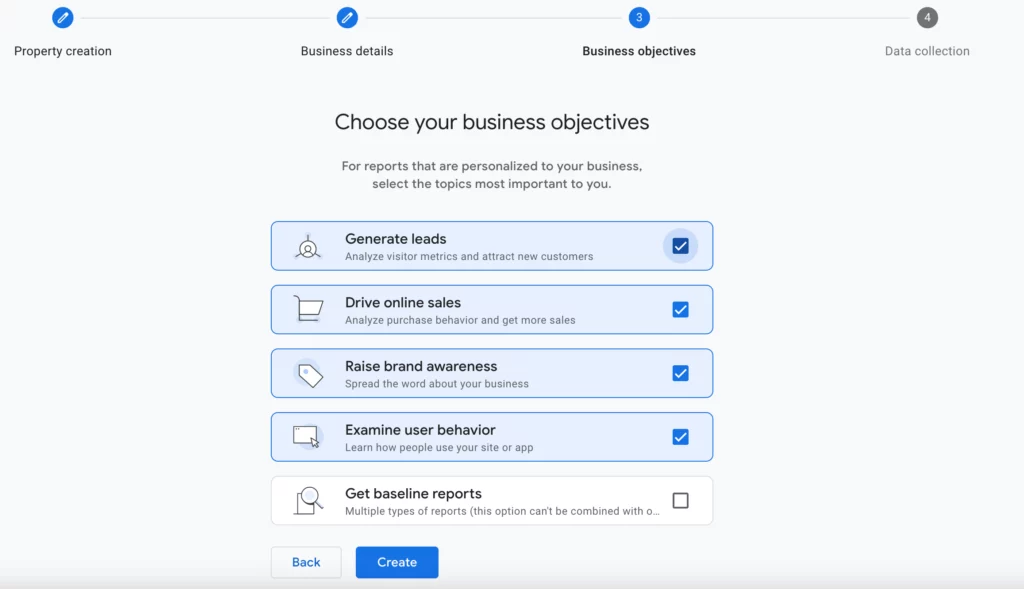
This will generate new reports on the sidebar tailored to those objectives, even though they are essentially the same reports that were previously available, only arranged differently.
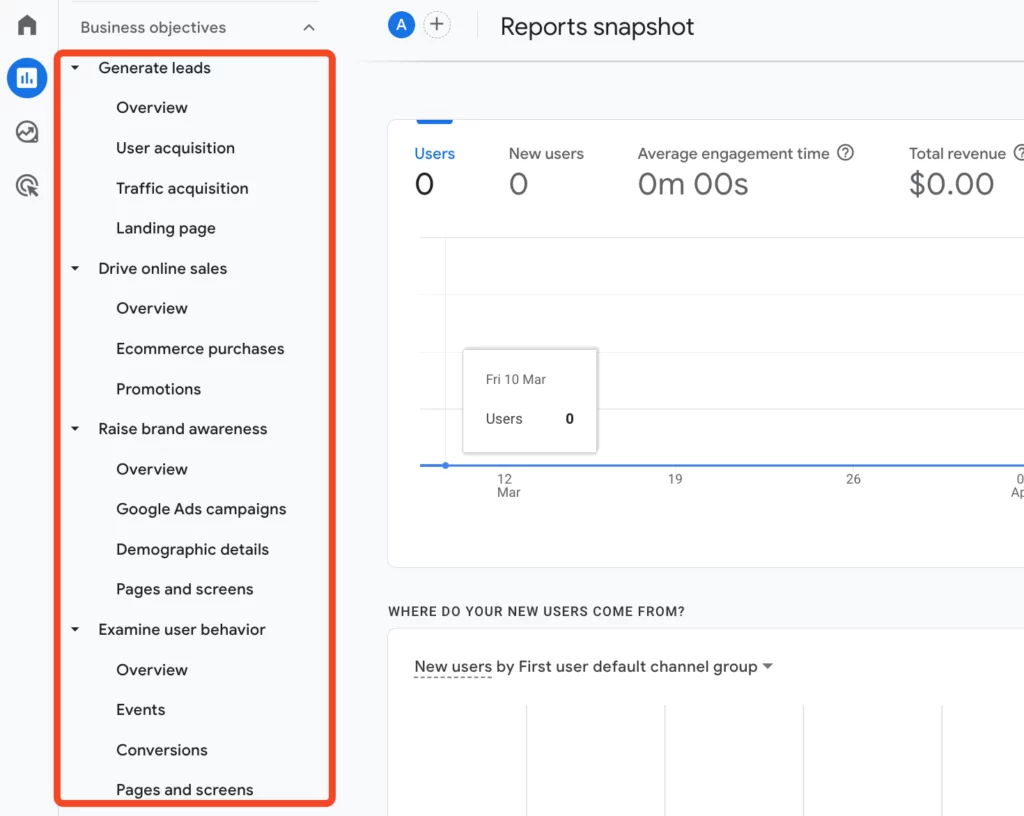
Note that the baseline reports option cannot be combined with other business objectives. However, if you opt for the “baseline reports” feature, the previous set of reports will remain accessible.
Configure Data Streams
When a website visitor fills in information through a website form or an app, it feeds into the Google Analytics account you created.
These are the data sources from which events for your GA4 property will be sent. A property can have multiple data sources. That way, your analytics and customer behavior are tracked across the various devices.
To add an analytics data stream:
- Click on Admin > Data Streams > Property
- Configure the app for either iOS app, Android app, or Web by selecting the respective platform type
- Select Create Stream
- Repeat for as many data streams as necessary

Enter the URL and name of your website. Notice that HTTPS is selected by default.
When setting up a web data stream in Google Analytics 4, the “enhanced measurements” button will be toggled on by default.
By leaving this toggled, Analytics will automatically track events that allow businesses to collect more data out of the box, such as page views, video engagements, outbound link clicks, and form interactions.
We’d recommend leaving this toggled on.
In general, the more data you’re able to collect, the better you’ll be able to optimize your website later.
Once done, click ‘Create Stream’. Congratulations! You’ve created your property and enabled a successful data stream!
How to Install GA4 Using Google Tag Manager
After you’ve created a property and data stream, you will be assigned a unique Measurement ID.
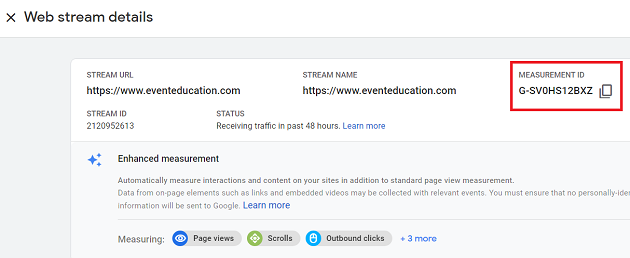
In the top-right corner, you’ll notice the tracking ID of your new property. Copy it. You’ll need to add it to Google Tag Manager (GTM).
If you ever get lost in the GA4 interface (it happens!) and need to get back to this page, return to the Admin > Data Streams page, then choose your most recently created stream
With the Tracking ID copied to your clipboard, visit your Google Tag Manager container > Tags > New, then choose “Google Analytics 4 configuration” and paste the ID into the respective “Measurement ID” field.
To automatically track page views (recommended), keep the “Send a page view event when this configuration loads” box checked.
Within the ‘Triggering’ section, select ‘All Pages’, and name the tag something descriptive like “Page View.” That way when this gets triggered, you’ll know what action they took.
That describes the most basic GA4 setup via GTM, but there is much more involved. We’re working on a a step-by-step guide, but in the meantime Julius at AnalyticsMania has a very comprehensive how-to.
Best Practices and Advanced Steps For Configuring GA4
These are just the basic steps, Google Analytics 4 is an extremely powerful tool and we’ve only scratched the surface.
Check out our article on the essential GA4 admin settings for a guide on the key configuration options like maximizing data retention, Google Signals for tracking additional demographic data, excluding internal traffic, and linking GA4 with Google Ads and Google Search Console.
To ensure you’re accurately tracking traffic from sources like social media, see our guide to UTM codes to better measure your marketing campaigns.
How To Use Google Analytics 4
Now that you both understand the power of the new platform and how to set it up, it’s time to learn how to navigate it and put it to use.
Here are a few basic tips that will make learning GA4 easier:
Explore the Improved Search Navigation Bar
The new search bar in Google Analytics gives you instant access to reports, insights, configuration options, and help content.
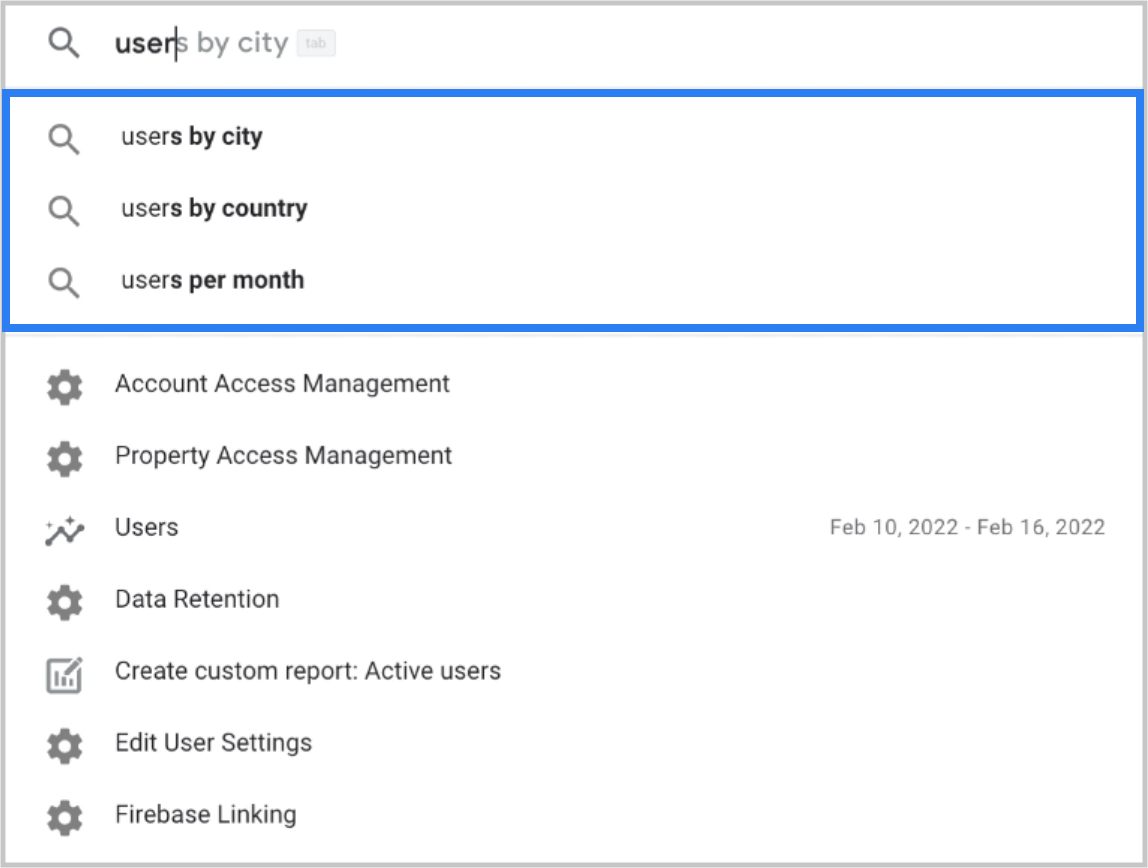
For example, once your site has collected enough data, you’ll be able to simply type in, “how many users this month vs last year?”, or “top city by number of users” and quickly get results.
As you become familiar with the new platform, this search bar will become invaluable.
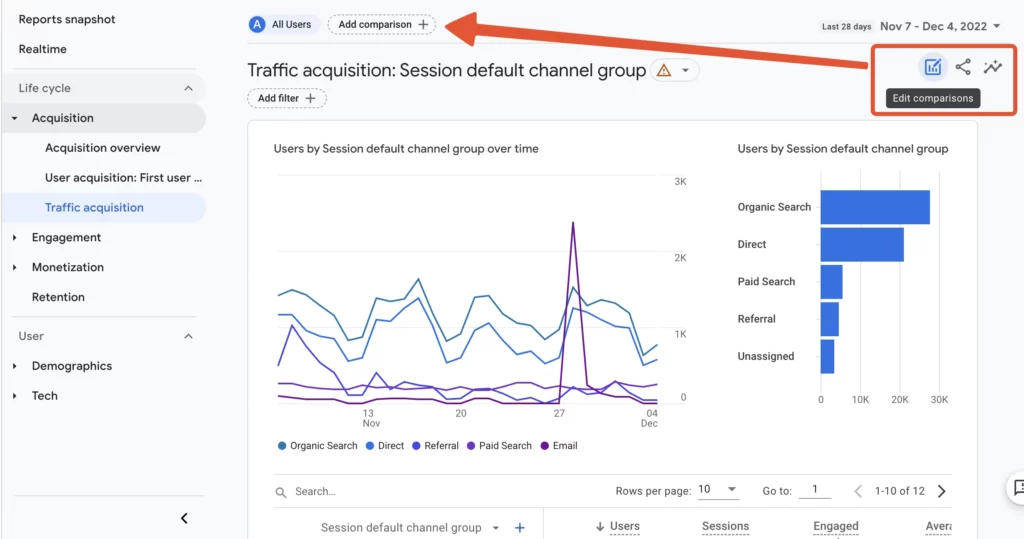
Get Familiar With The New Reports Dashboard
On the surface, the redesigned dashboard might feel familiar to the old version. But if you explore further, you’ll discover that most reports have moved around or disappeared entirely.
From the main dashboard, click on the graph icon on the left nav bar:
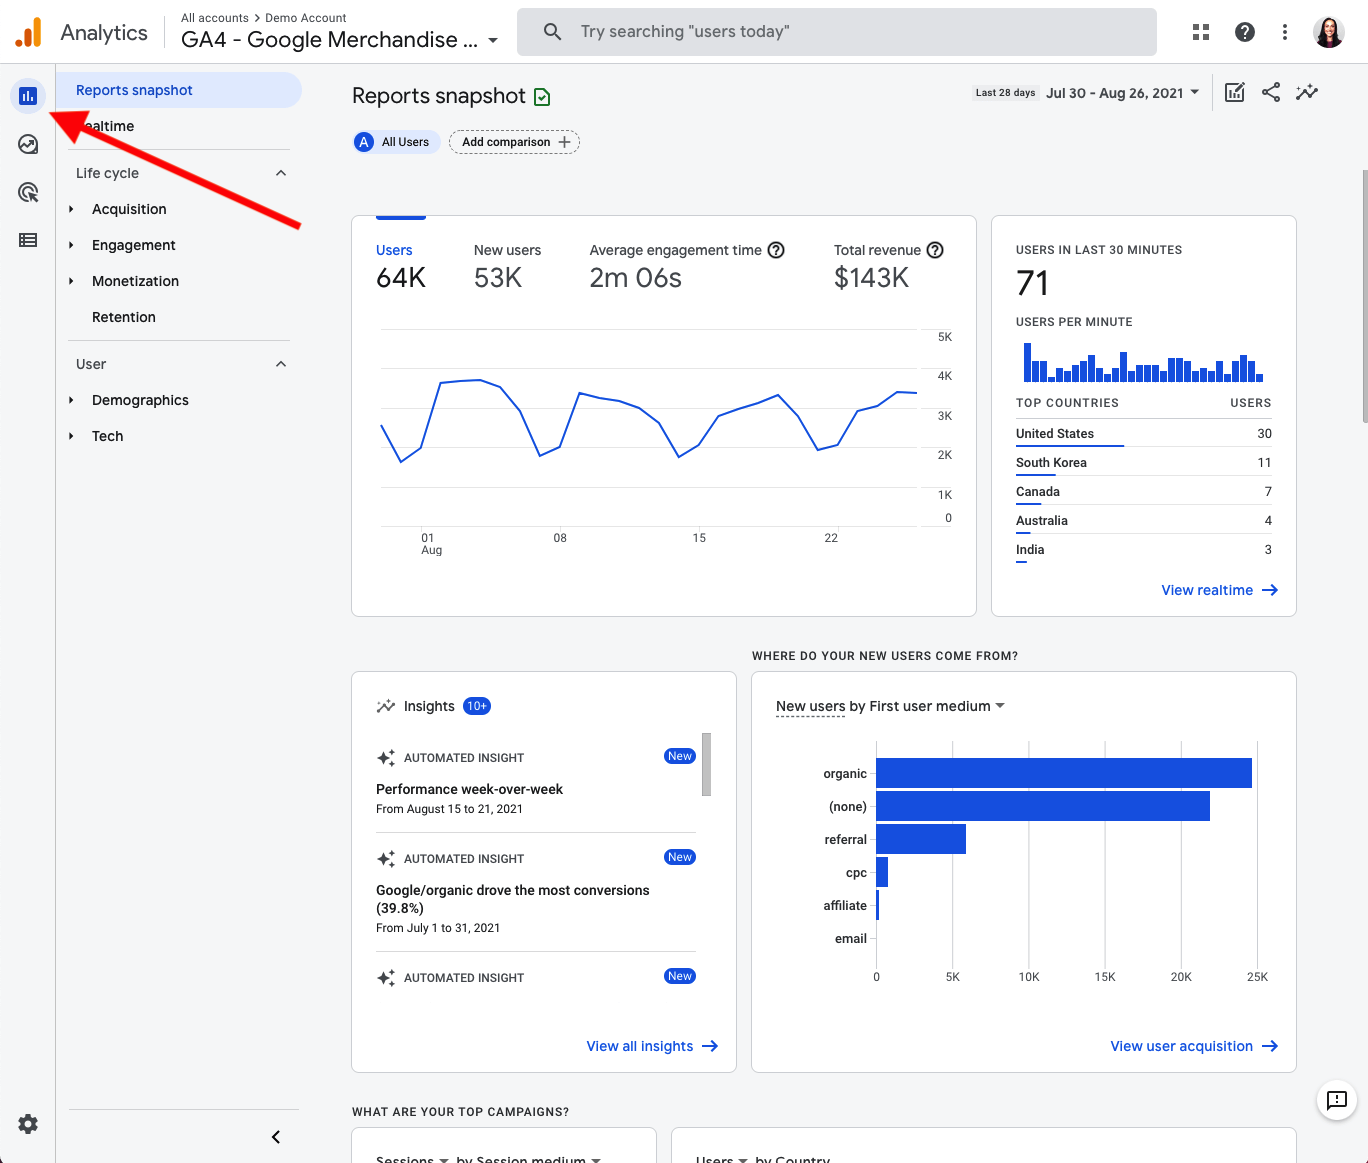
The Reports dashboard displays snapshots of the different reports you can view. When you’re trying to find answers and insights, this is where you’ll find it.
For example, you can see how many people viewed a specific page, where your traffic is coming from, sales/monetization reports, and user demographics.
To compare different metrics, select the + icon at the top next to Engagement Overview.
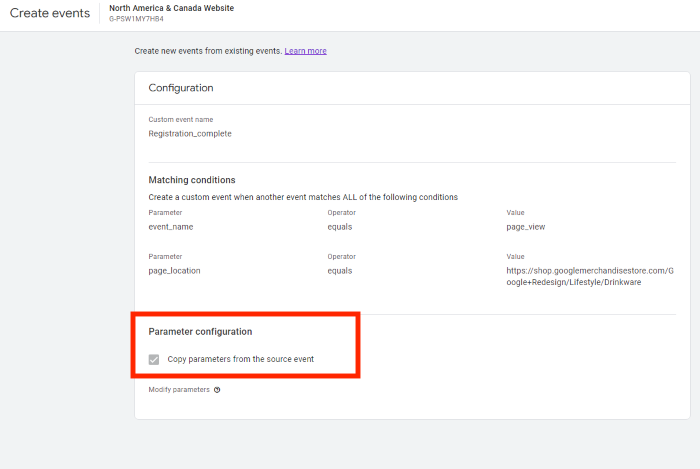
How to Create A New Event in Google Analytics 4
In the new Google Analytics, events are your best bet for tracking just about everything.
Note: You will need an editor role in GA to make these changes, so if you don’t see the options mentioned below, that may be the issue
- Click Configure > Events
- Then select Create Event
- Select the correct data stream (only if you’ve created more than one property in Analytics)
- Then choose Create
- Name your report something you’ll easily be able to identify later
For example, if using audience location and acquisition channel for a report, you might name it “Canadian visitors from social media”
- Under “Matching Conditions” enter the name of the event that took place, such as “clicked”
- To copy a parameter from an existing event, select “copy parameters from the source event”
See Suggested Audiences
When you create a GA4 property, you’ll tell Google about your business.
Google then uses this information to generate ‘suggested’ audiences that may be a good fit for your business. If you’re looking to expand your user base or break into new markets, this can be crucial information.
To view the suggested audiences, head to “Audiences” under Library, then choose “Build a New Audience.”

Leverage These 3 Key Reports in Google Analytics 4
When you first log in to GA4, you’ll see that the home page summarizes overall traffic, conversions, and revenue for your property. This is a good way to check whether things are behaving as expected.
By looking at your home page report, you can see where new users come from, which of your campaigns are performing best and how many people are viewing specific pages.
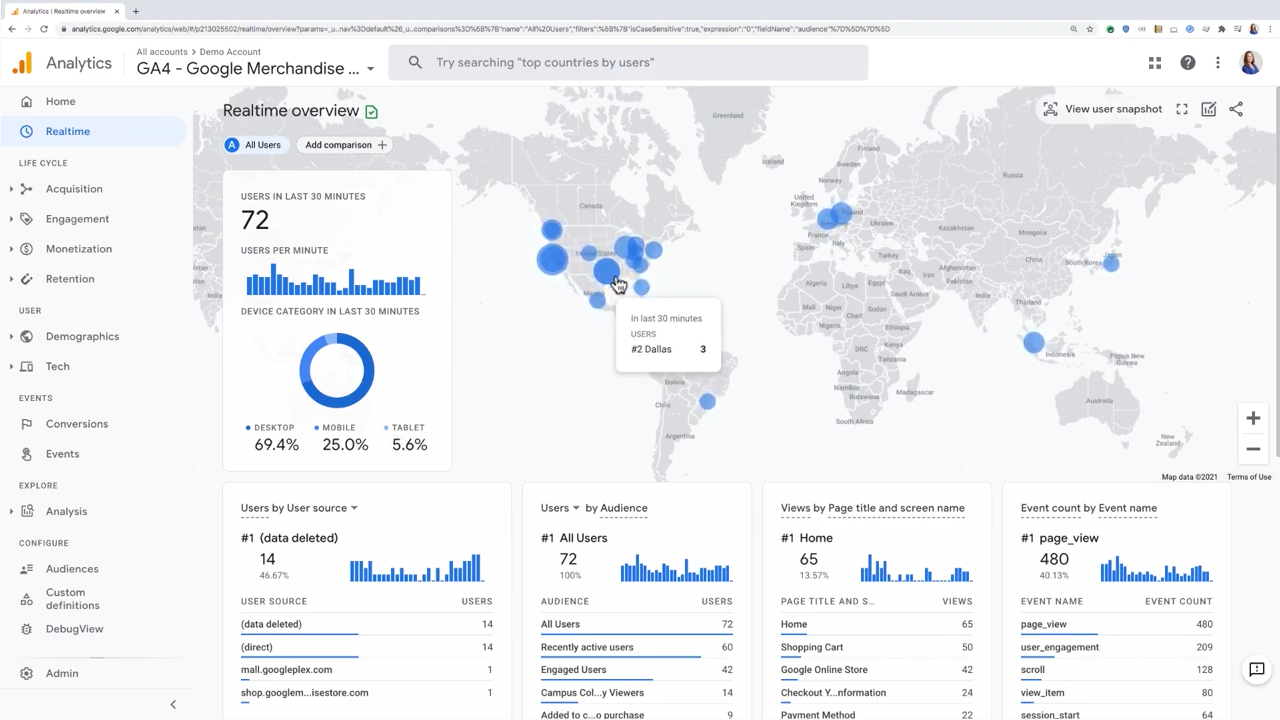
1. Real-time Reporting
The Realtime Report, the second report under the left navigation, shows events that occurred within the past 30 minutes.
Use the Realtime Report to monitor data that is being collected in real-time on your website or app. This report can also be used to verify if a promotional campaign is properly sending data in real-time, to identify user behavior and how they found your site, and to test if event-based conversions are being tracked properly.
This section allows you to view a single user’s activity by clicking the “User Snapshot” button on the top right of the Realtime report. This will provide information about the device, location, and engagement with the site/app through events triggered.
2. Lifecycle Reports
The lifecycle report is a funnel-like view of your business that shows how users enter the conversion funnel and how they behave once they’re in it.
GA4 also provides user reports on demographics, the technology used, events, and conversions.
3. User Explorer Reports
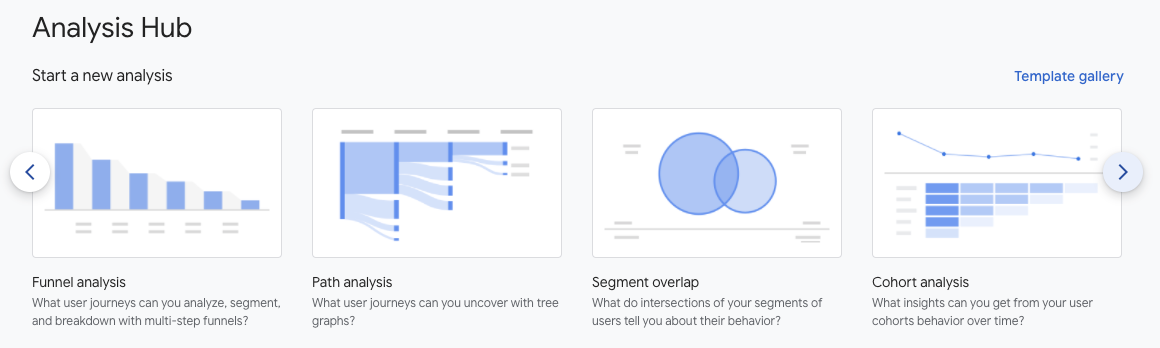
The Analysis Hub may be the most powerful change for businesses in GA4, allowing you to monitor key business metrics via a useful template gallery.
To Create a New Analysis
- Click the “Analysis” menu option on the left with the magnifying glass, under “Explore”
- Select one of the techniques listed to analyze your data with:
Types of GA4 Analyses
Here are the reports you’re likely to come across in GA4 and what they’re used for.
Exploration Report
The Exploration Report provides more control over data visualization than was previously available in Universal Analytics.
One particularly useful insight is “anomaly detection”—an algorithm that flags any data points that are outside of the expected outcome.
Funnel Analysis Report
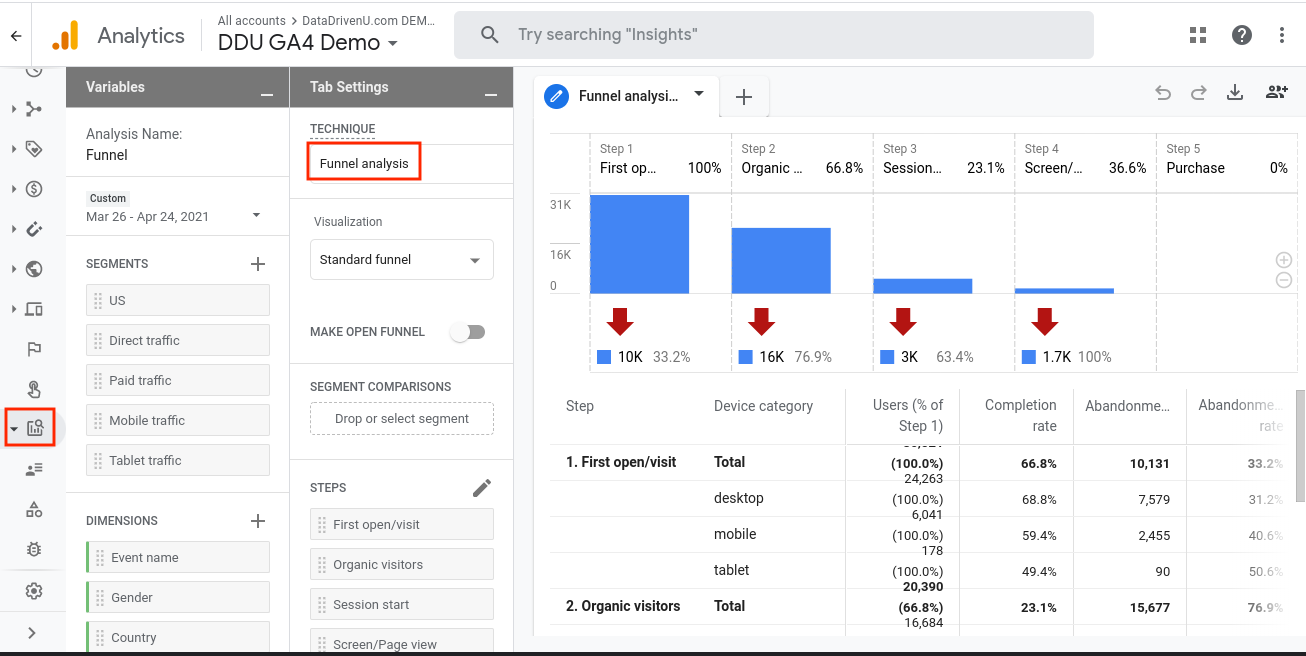
What steps do website visitors take before they become customers and then what steps do existing customers take to become repeat customers?
The GA4 funnel report allows you to visualize the steps users take to complete an event and whether they are succeeding (or failing) at each step.
Path Analysis Report
An event stream is a series of events triggered by users along with their overall user experience. Path Analysis visualizes that event stream in a “tree graph”.
The path analysis technique is useful to businesses because it can help them spot signs of looping behavior that may indicate users becoming stuck on a particular task.
Segment Overlap Report
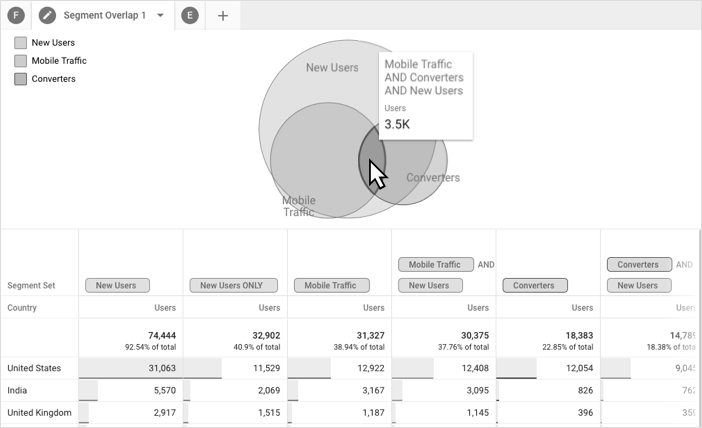
Segments are groups of your site visitors. In GA4, segments can be used to define events and sessions.
You can create segments with multiple conditions and arrange them into a “condition group.”
For example, you can create a segment of users from a specific city or users who have visited a specific page on your site or purchased from a particular product category.
Cohort Analysis Report
Cohorts can be defined by a common characteristic, such as the same acquisition date or whether they converted via a specific event like a promotion.
A good way of using this is to create a cohort report to see how long it takes people to convert after receiving a specific marketing tactic.
User Lifetime Report
This is an extremely powerful tool using prediction models because it allows you to determine which source is driving users with the highest lifetime revenue—not just revenue for a selected month.
For example, using the lifetime report you can identify the campaigns that acquire the highest value customers, with the lowest churn and highest conversion rate
Ready to Get Started with Google Analytics 4?
GA4 is a powerful analytics tool that provides invaluable insights into your audience. The steps above are for a basic installation – there are several key steps outside the scope of this article (it’s already really long!) including increasing data retention time, full Google Tag Manager setup, how to track form submissions, enabling Google Signals, and connecting GA4 to Ads and Google Search Console. Learn more in our article on often overlooked GA4 admin settings.
If you’re looking for more help, Big Cedar can handle all or part of the configuration for you. See our GA4 migration packages or contact us today for a free discovery call.
Sources:
[1] https://w3techs.com/technologies/details/ta-googleanalytics